Cyber program intelligence
Cybersecurity Uplift Program
“Where is our cyber program really at, and what needs attention this week?”
Why teams buy this
- The decision
- Where is our cyber program really at, and what needs attention this week?
- Cost of a wrong call
- Evidence gaps found during the audit rather than before it, and a board that sees maturity and delivery in different decks.
- What you'd do otherwise
- Separate status decks for maturity, risk and delivery, rebuilt by hand each reporting cycle.
- What you see first
- Maturity across 106 controls mapped between NIST CSF 2.0 and ISO 27001, residual risk against appetite, and the delivery work behind each gap.
- Start here
- Set up with you on your own data: sized per client, starting with a $750 Practitioner Review. Or start with the free Business Soundcheck. Practitioner Review
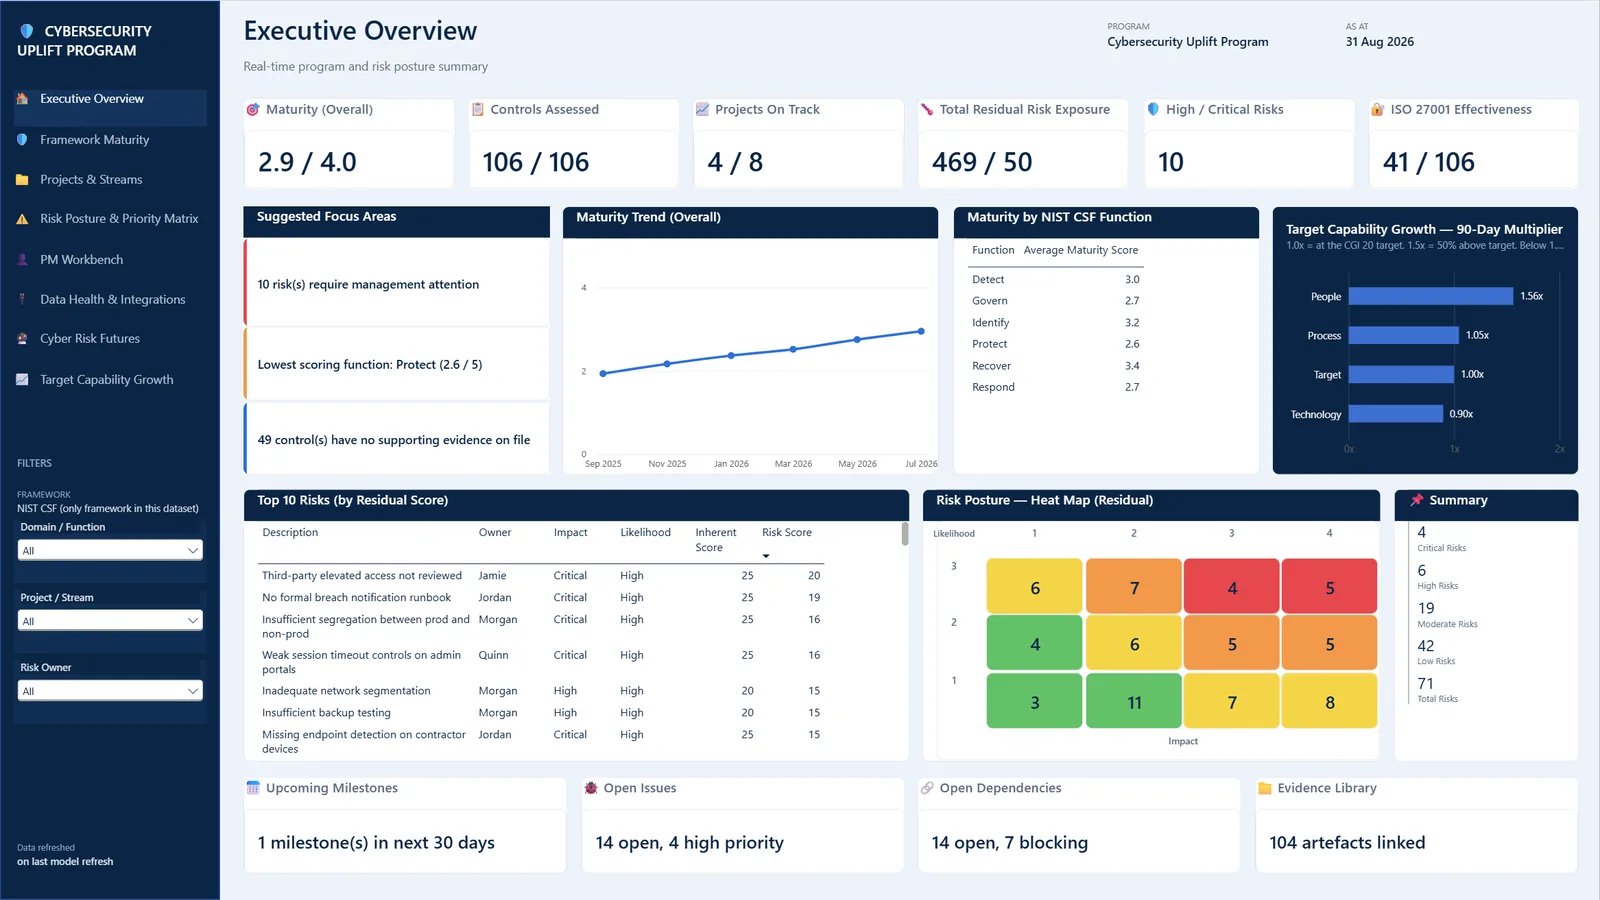
8 report pages · hover to hold, select a frame to view it
What it shows
- Eight integrated pages, from the executive summary down to the PM workbench and data health.
- NIST CSF 2.0 and ISO 27001 maturity, evidence coverage and control effectiveness in one view.
- Program delivery (milestones, RAID, dependencies) next to risk posture, not in a separate deck.
- A config-driven model that re-points to a new client's Excel, Planner or Jira extracts.
Outcomes
- One weekly view replaces several status packs.
- Evidence gaps surface before the audit, not during it.
- A board-ready maturity trend and residual-risk heat map.
Built for: CISOs, cyber program managers and risk committees running a multi-stream uplift.
Product specification
Eight report pages on one model: Executive Overview, Framework Maturity, Projects & Streams, Risk Posture & Priority Matrix, PM Workbench, Data Health & Integrations, Cyber Risk Futures and Target Capability Growth.
Maturity is scored 0 to 4 across 106 controls and rolled up by CSF function. Residual risk is likelihood times impact against an appetite line. The Capability Growth Index projects People, Process and Technology need at 90 days, 1 year and 3 years from a sigmoid-fitted threat curve and a 5,000-run Monte Carlo, shown as P50 planning and P90 stress views.
- Pages
- 8
- Controls
- 106 (CSF 2.0 ↔ ISO 27001)
- Horizons
- Now · 90D · 1Y · 3Y
- Format
- Power BI (PBIP), Excel / CSV extracts
How it's delivered: days, not months
- ScopeA short call to agree the decision it needs to support and which data you already have.
- LoadYour exports go into the model's CSV templates. No live connection to your systems is needed to start.
- RunThe model runs on your data, and every number traces back to its inputs and the documented method.
- Hand overYou keep the Power BI file, its design walkthrough and engineering companion, or our practitioners run it with you each month.
See Cybersecurity Uplift Program running on your own data.