Workforce and capability
IT Future: Workforce & Capability
“Will we have the people and skills the roadmap needs?”
Why teams buy this
- The decision
- Will we have the people and skills the roadmap needs?
- Cost of a wrong call
- Roadmap commitments made against capacity you do not have, and key systems that depend on one person.
- What you'd do otherwise
- A headcount spreadsheet that compares roles rather than skills, and ignores who holds the knowledge.
- What you see first
- Capacity against roadmap demand by team and quarter, single points of failure, and hire, upskill or blend options priced per FTE of gap closed.
- Sample result
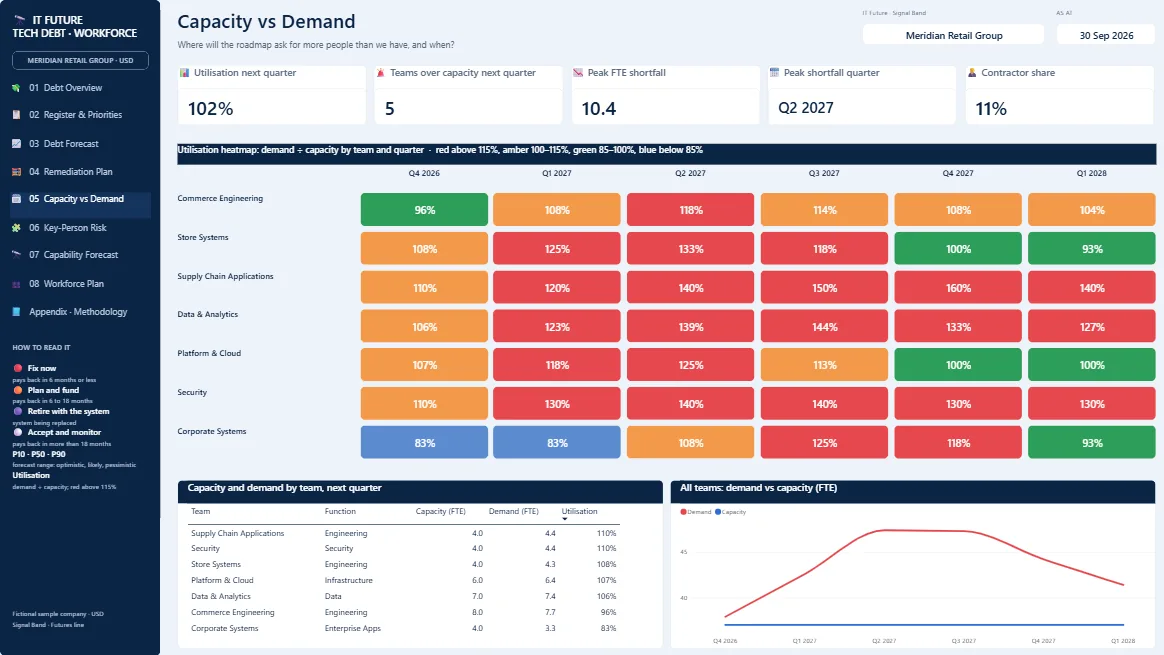
- 102% utilisation next quarter, peaking at a 10.4 FTE shortfall in Q2 2027. Meridian Retail Group, a fictional retailer. Illustrative sample data.
- Start here
- Buy the Power BI pack ($690, both IT Future products) and run it on your own exports, or start with the free Business Soundcheck. See the pack
What it shows
- Where the roadmap needs more people than you have, and when.
- Which systems depend on one person, and what debt sits on them.
- Whether skills supply meets roadmap demand over 6 quarters, as P10 / P50 / P90 ranges.
- Hire, upskill or blend: cost and share of the gap closed.
Outcomes
- Capacity shortfalls named by team and quarter before they delay delivery.
- Single points of failure linked to the systems and debt they carry.
- A workforce plan priced per full-time equivalent of gap closed.
Built for: CIOs, heads of engineering and HR partners planning technology capability.
Product specification
Four report pages plus a methodology appendix: Capacity vs Demand, Key-Person & Skills Risk, Capability Forecast, and Workforce Investment Plan.
Capacity is compared with roadmap demand by team and quarter. Key-person risk links each single-expert system to its technical debt, so it pairs with IT Future: Tech Debt. The skills gap is forecast over 6 quarters with a Monte Carlo simulation, and each option is costed per full-time equivalent of gap closed.
- Pages
- 4 + appendix
- Forecast
- 6 quarters, P10 / P50 / P90
- Options
- Hire · Upskill · Blend
- Format
- Power BI (PBIP), CSV inputs
How it's delivered: days, not months
- ScopeA short call to agree the decision it needs to support and which data you already have.
- LoadYour exports go into the model's CSV templates. No live connection to your systems is needed to start.
- RunThe model runs on your data, and every number traces back to its inputs and the documented method.
- Hand overYou keep the Power BI file, its design walkthrough and engineering companion, or our practitioners run it with you each month.
What's in the box · IT Future (Tech Debt + Workforce & Capability) pack
Power BI report
- Tech Debt Overview
- Debt Register & Priorities
- Debt Forecast
- Remediation Investment Plan
- Capacity vs Demand
- Key-Person & Skills Risk
- Capability Forecast
- Workforce Investment Plan
- Appendix — Methodology
Guides
- Design Walkthrough, 21 pages (PDF and Word)
- Engineering Companion, 29 pages (PDF and Word)
- Agent implementation kit: ordered steps with a check at each one, a file manifest with checksums, a JSON Schema for every data file and a validator, so an AI agent or engineer can implement it without guesswork
Data
3 configuration · 10 synthetic sample data CSV files. The sample organisation is Meridian Retail Group, a fictional retailer (USD, as at 30 Sep 2026); no real client data is included.
How results are calculated
Debt drag, the 8-quarter debt forecast, the 6-quarter skills forecast and the investment plans are calculated by Signal Band's IT Future engine (2,000-run simulation) before the data is loaded; the calibration stays with the engine. The pack ships the sample organisation's results. To recalculate with your own data, run the engine on your inputs: 10 credits a run through the API once the it-future engine is live, and until then email your inputs to [email protected] and we run it for you at the same credit cost.
Verify your install: the guide lists 5 numbers the report must show on the sample data.
You need
- Power BI Desktop (Windows)
Not included
- Implementation support
- Technical support beyond documentation
- Practitioner interpretation (available as Practitioner Review)
One-off payment, no subscription. One organisation. 12 months of updates. Every download is stamped with your licence record. Digital products are delivered immediately, so purchases are not refundable except where the law requires (your Australian Consumer Law rights are not affected). Licence terms.
Three ways to use it
Self-serve · engine
Engine coming soon
This product's engine is being prepared for the API. Run the free Soundchecks in the meantime.
DevelopersSelf-serve · Power BI
Buy the pack · $690
The Power BI report, guides, sample data and agent implementation kit listed above. Covers both IT Future products: Tech Debt and Workforce & Capability. One organisation, 12 months of updates, no support.
With a practitioner
Set up and run with you
A practitioner runs it on your data and interprets the result. Sized per client, starting with a $750 Practitioner Review.
Book a walkthroughSee IT Future: Workforce & Capability running on your own data.
More in Futures
 Cyber Future A forecast of the capability each pillar needs as the threat landscape grows.
 AI Future How fast AI adoption and AI-related threats are growing against the governance you have.
 IT Future: Tech Debt The monthly cost of technical debt, a priority register, and what a given budget pays back.